This section provides brief graphical information about the capabilities and options presented by the Integration App. The following 'settings' and 'dashboard' sections are covered to get you started.
- Access data flows
- Turn on/Turn off data flows
- Schedule data flows
- Run data flows
- View flow status in the dashboard
- Resolve errors
- Customize data flows
- Modify integration field mappings
- Manage integration connections
- Share and monitor Integration App
- Set up notifications
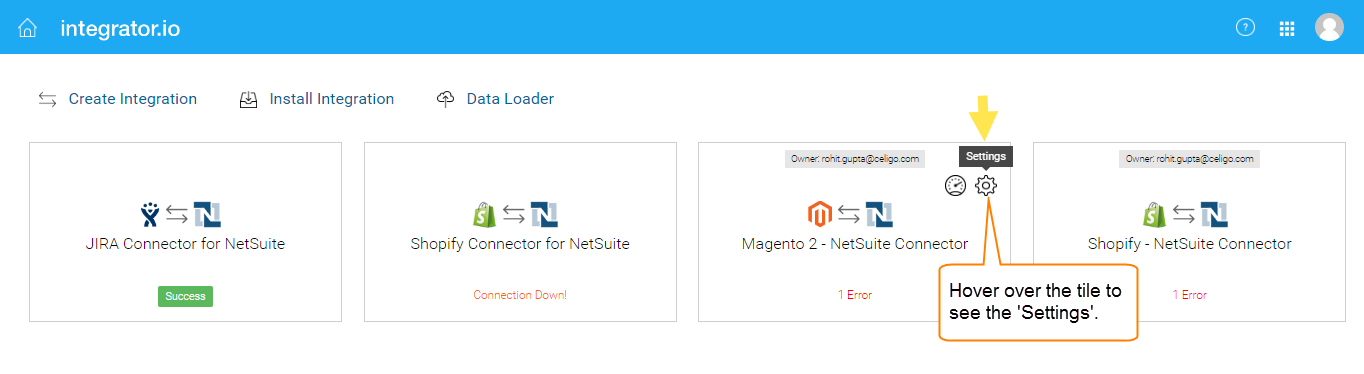
Access data flows
The home page of the Integration App displays the integrations and Integration App as tiles. To access data flows, go to the Integration App settings as shown. Hover over the tile to see the options.
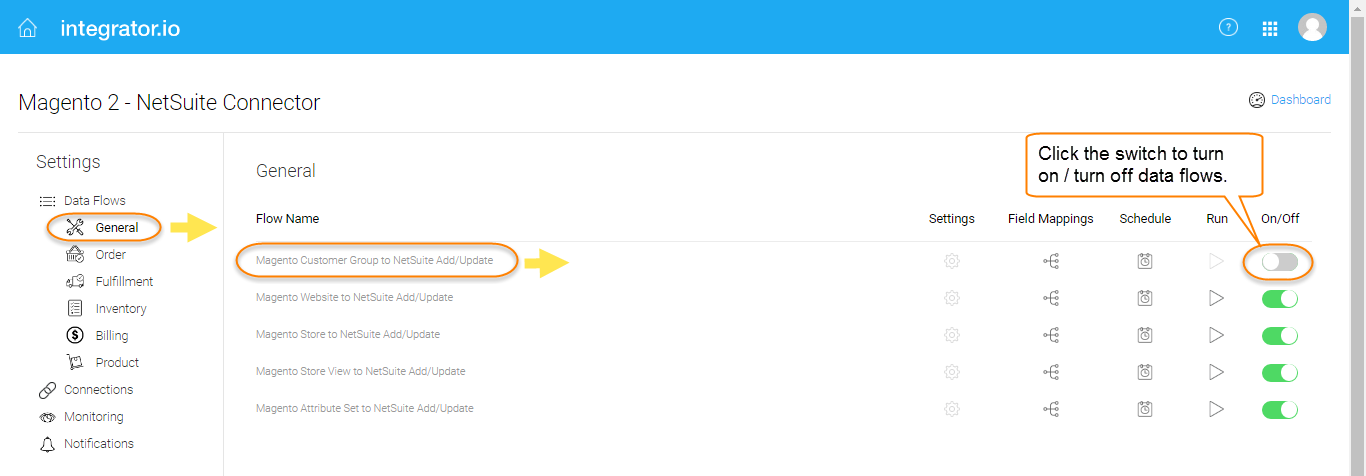
The data flow settings dashboard is displayed. Each flow group consists of individual data flows.
Turn on/Turn off data flows
Go to the data flow group, select the individual data flow and turn on / turn off the data flow. Grey color switch indicates the flow is turned off. Green color switch indicates the flow is turned on.
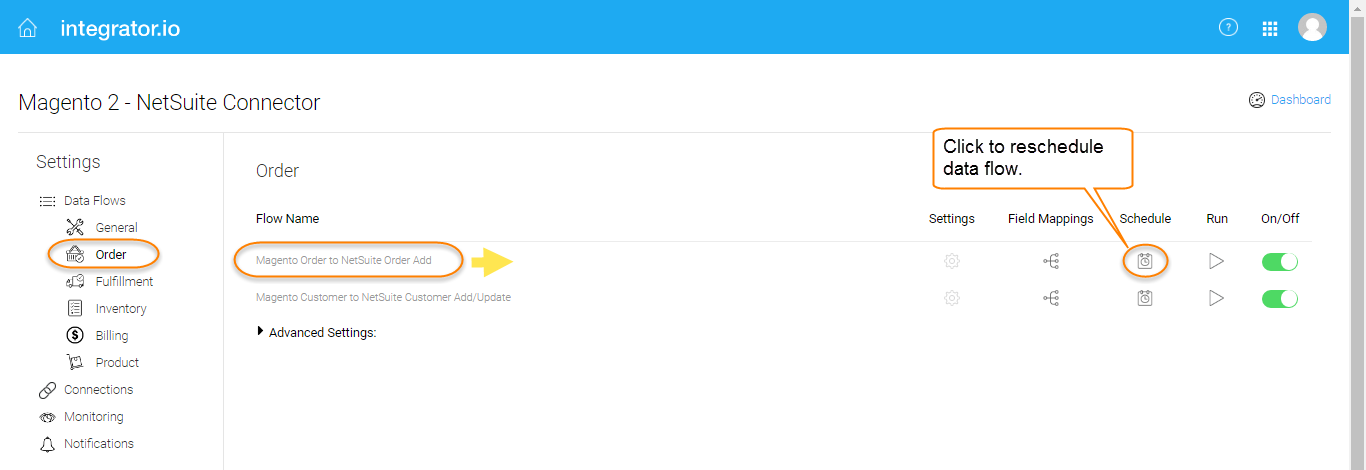
Schedule data flows
This section enables you to modify the scheduled flow. You can select time zone, alter frequency, start time, day to run on etc. You have both pre-set and cron options.
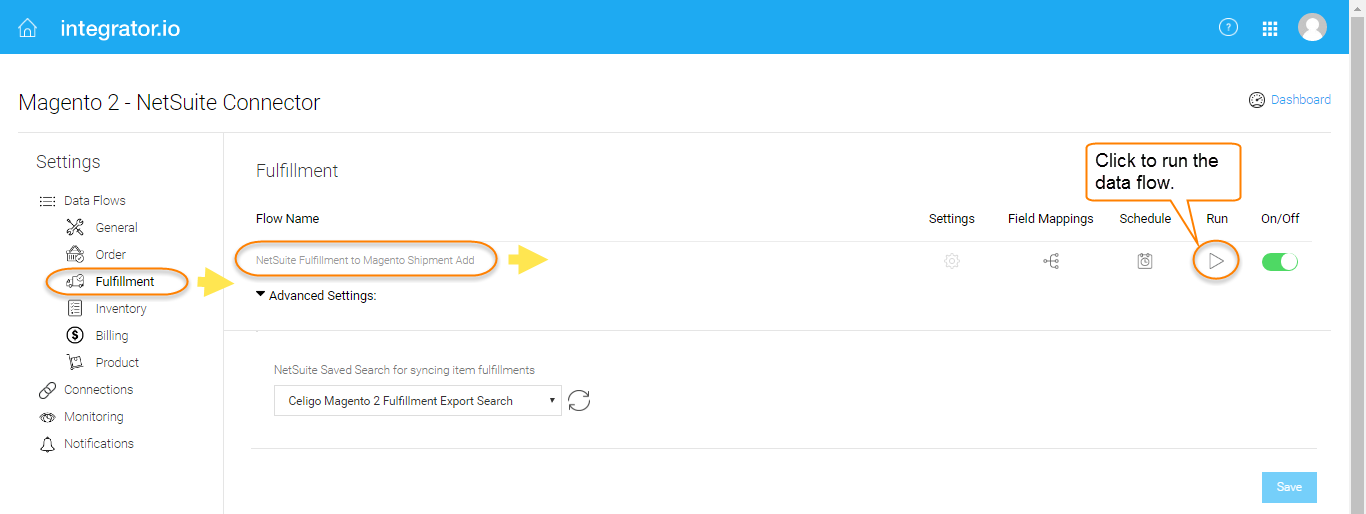
Run data flows
Go to the desired data flow and click the 'Play' button to run the data flow.
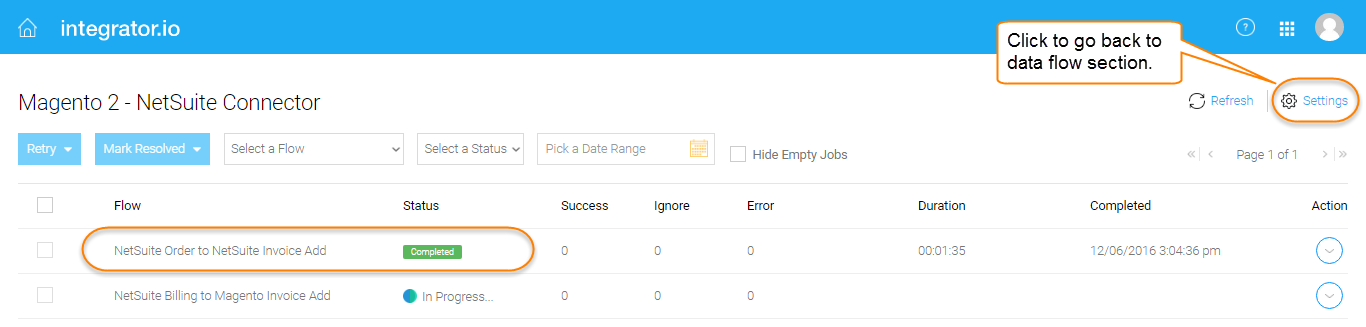
View flow status dashboard
When you run a data flow from the 'settings' section, the dashboard page is displayed and provides the status of the data flow. The integration progresses through the following stages: in queue, in progress, and completed.
You can filter integration jobs based on options such as date ranges, flows with errors or based on other statuses, etc. You can hide empty jobs. The number of records exported are indicated. Failed flows or flows with errors are categorized by color code. Errors can be resolved from within the dashboard.
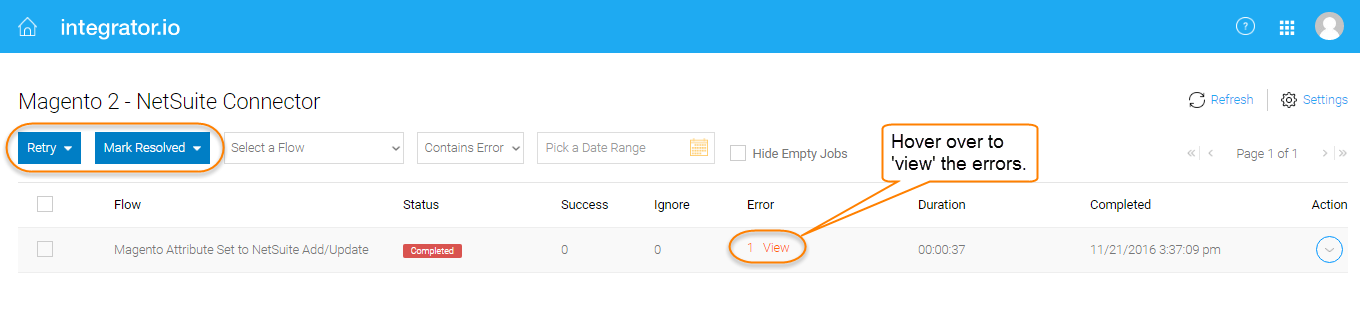
Resolve errors
Errors are indicated by color codes. Fully red indicates all errors, partial red-partial green indicates that some records were successfully imported and some were not; fully green indicates that all records were successfully imported etc. You can 'view' the errors and resolve them from within the dashboard. For detailed information, refer topic on error handling.
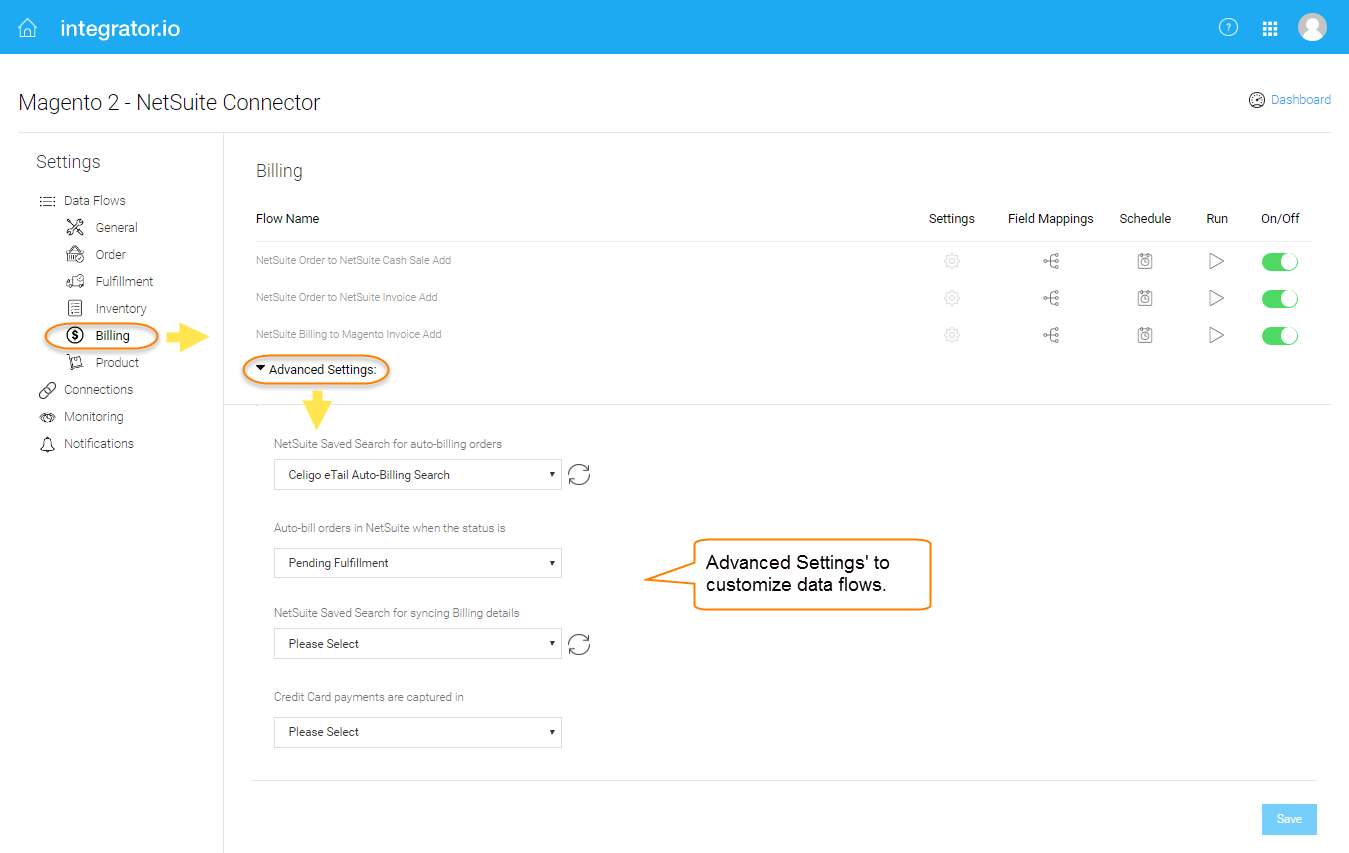
Customize data flows
Every flow group/ data flow can be customized from the 'Advanced Settings' section.
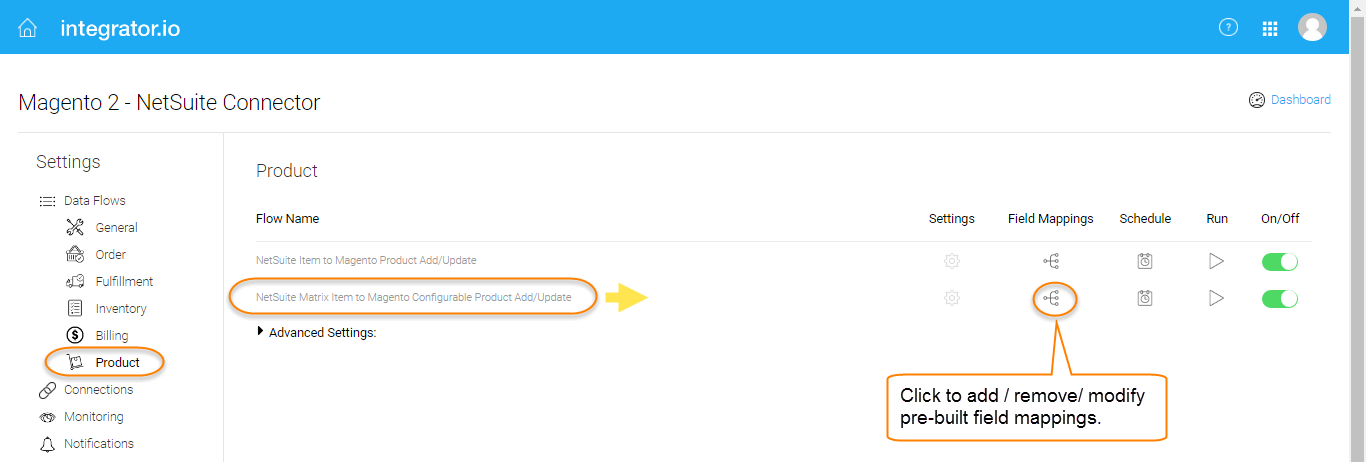
Modify data flow field mappings
The data flow comes with pre-built field mappings, but you can add/remove/modify the field mappings. For detailed information, refer topic Field Mapping Options in Integrator.io.
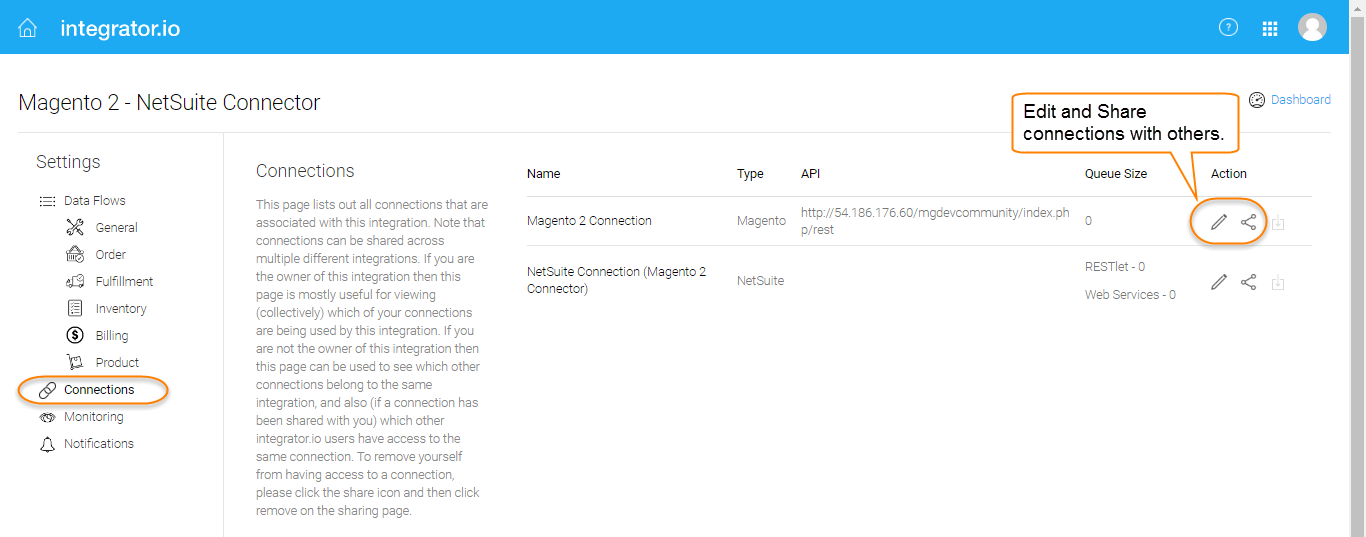
Manage integration connections
You can access, update and share your connections and credentials with your team members with integrator accounts. For detailed information, refer section manage and share connections in Integrator.io.
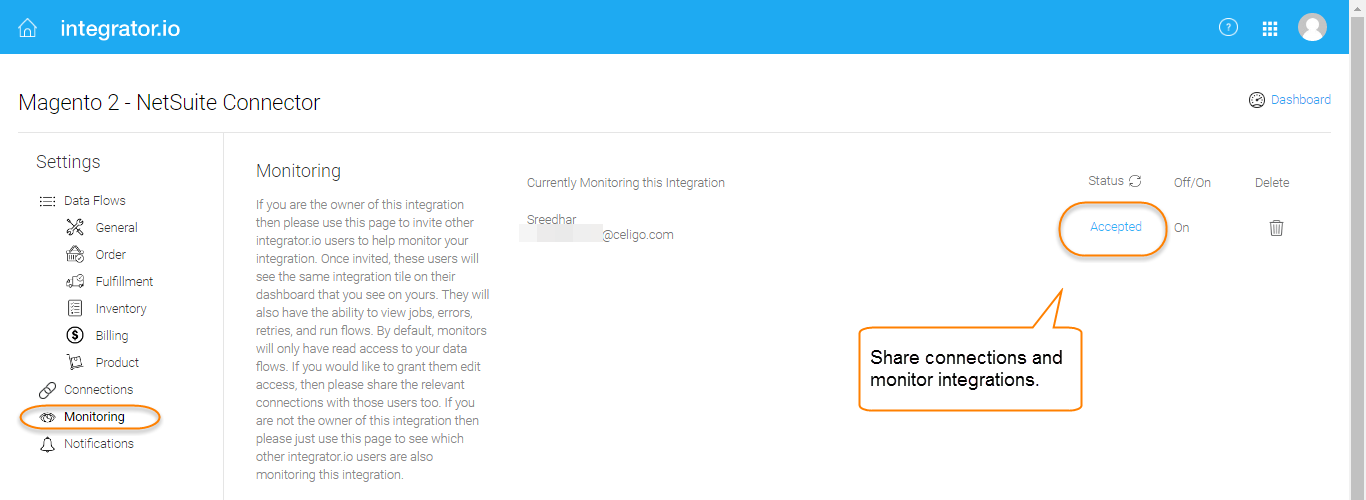
Monitor Integrations
You can share your connections with your team members and monitor your integrations. A notification is sent to the recipient and the recipient has the option to accept or reject the request. You can also delete the integration from this section. To remove the integrations, first all connections must be removed (deleted). Refer topic manage and share connections in Integrator.io.
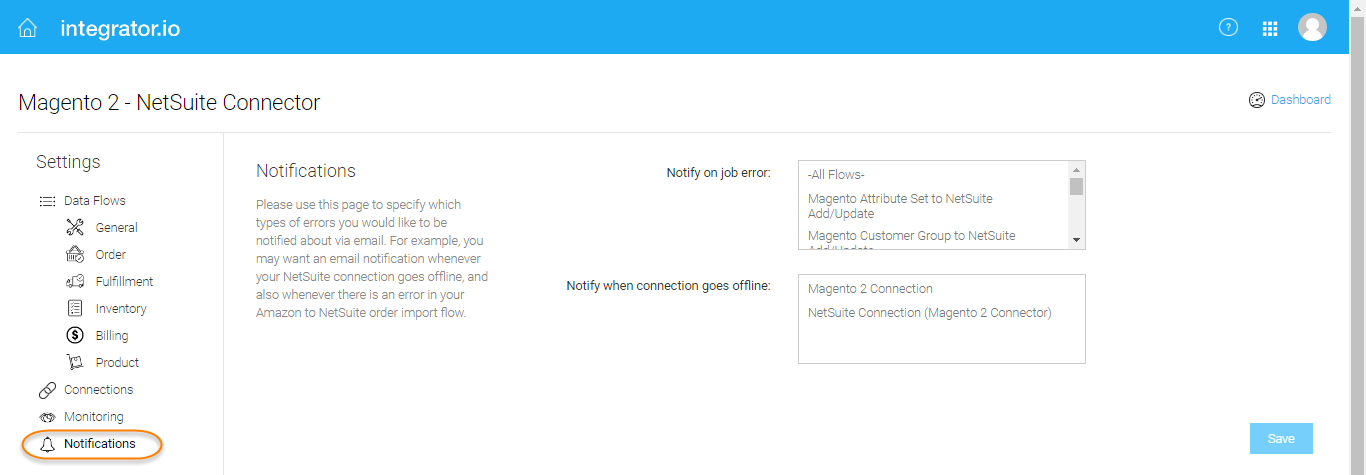
Email Notifications
You can set up the Integration App to send and receive notifications, whenever the integration encounters any errors or when a connection goes offline. Refer to topic email notifications in Integrator.io.
For detailed information on the platform capabilities, go to the Integrator.io section.